
2026-01-12 · X archive
Navigating the Chaos Corridor — original essay
Quantile regression and LPPL
Archive — different model. The January 2026 X essay. It uses quantile regression and LPPL. That is not the live ±1.5σ engine.
Published on X, 12 January 2026. Original post.
Giovanni Santostasi first identified Bitcoin’s long-run power law. Stephen Perrenod independently modelled the same family of laws, and recognised and interacted with this original piece.
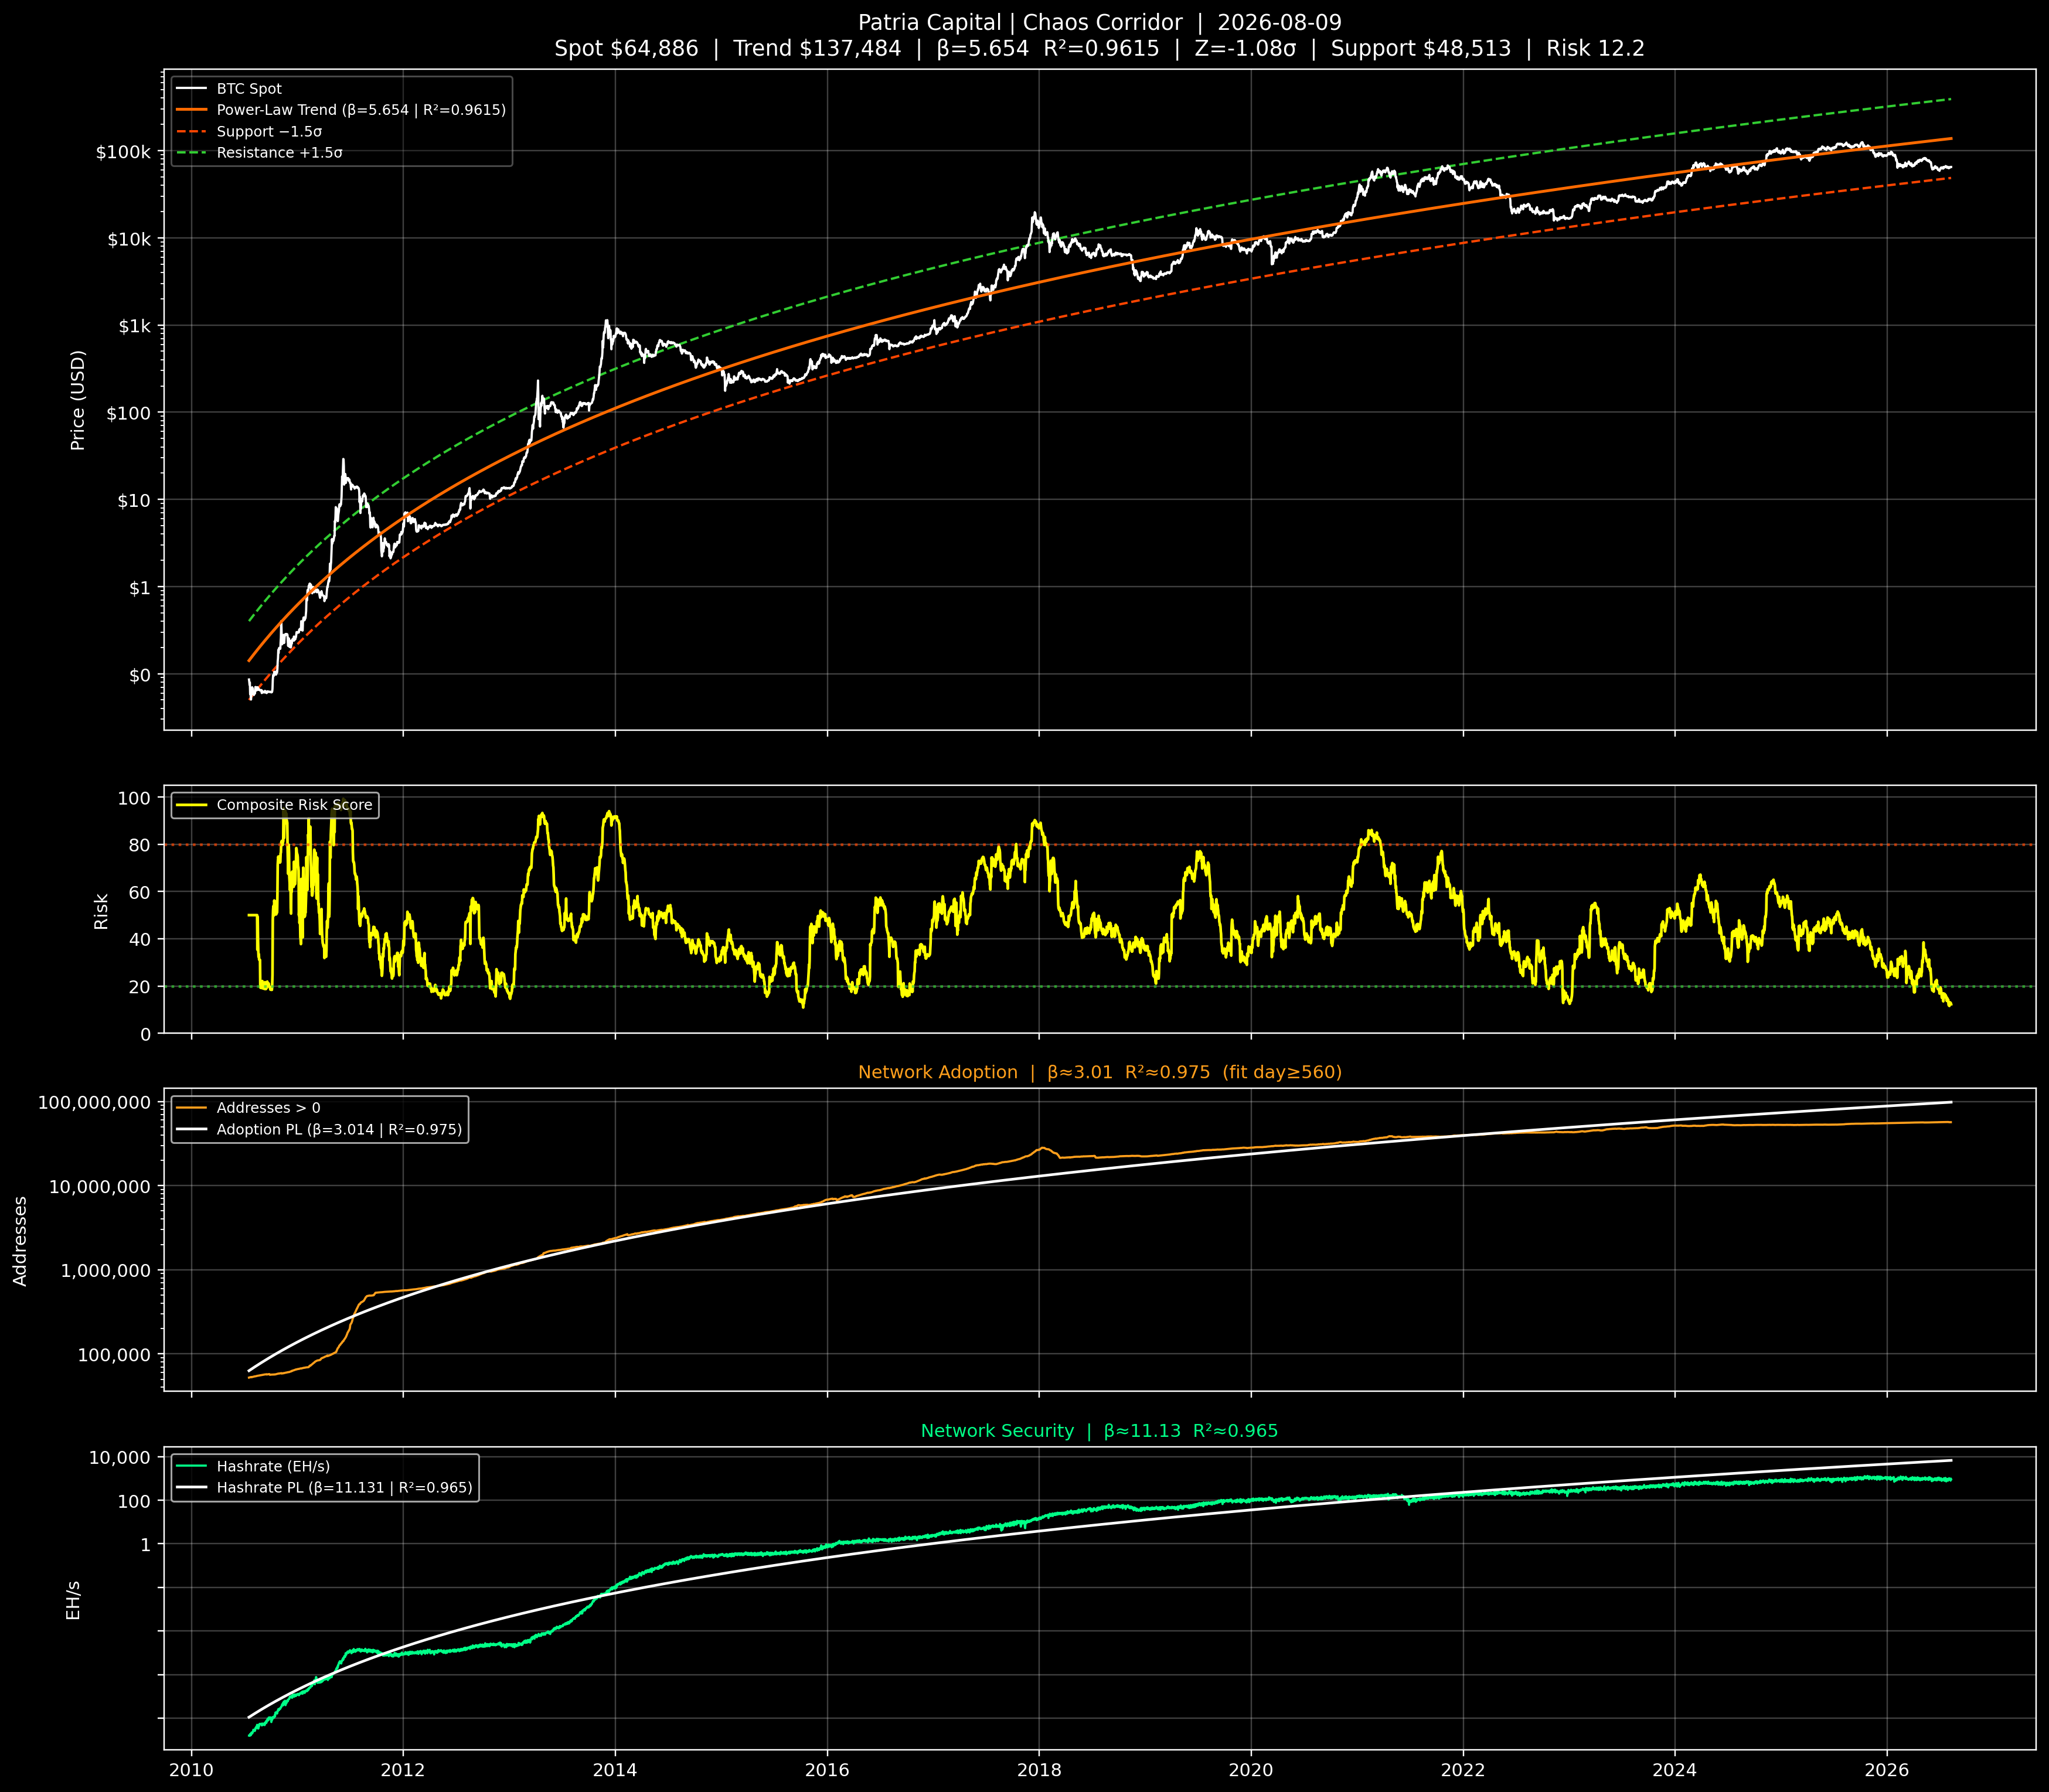
The Chaos Corridor is a statistically bounded monetary ecosystem, a tunnel within which Bitcoin’s price evolves under persistent power-law dynamics. It is not merely a curve or trend; it is the envelope of energy accumulation, compression, and release within a system constrained by supply, adoption, and network security:
P(t) ~ A · t^n
Across multiple estimation techniques — ordinary least squares (n ≈ 5.69), median quantile regression (n ≈ 5.82), and pairwise delta analysis (n ≈ 5.74) — the exponent converges near 5.7, reflecting sustained super-linear adoption. This spine is structural, directional, and persistent, indifferent to volatility, drawdowns, or euphoric spikes. It is the mathematical heartbeat of Bitcoin, underpinned by hashpower, settlement finality, issuance constraints, and network adoption metrics.
Quantile regression wraps the spine
- Lower quantiles (3–25%): compression zones, deep accumulation, latent energy.
- Upper quantiles (85–99%): rapid dispersion zones, where stored energy is released via singularity-like repricings.
- Median quantile: dynamic fair value, corridor centre of mass.
What appears chaotic is energy redistribution, not disorder. Volatility clusters as adoption, liquidity, and sentiment arrive asynchronously. At the January posting, price (~$91,000) sat in lower-quantile compression, historically a prelude to expansion, with supports between $65,000–$80,000 representing where energy has historically condensed.
Singularity events and log-periodic scaling
Resolution occurs through singularity-like events — bubble formations with log-periodic acceleration — where adoption and liquidity overcome the system’s ability to distribute smoothly.
Quantitative support included:
- LPPL / Money or Debt data: λ ≈ 2.07; fundamental modes observed in BTC/Gold residuals (2011, 2013, 2017, projected 2027).
- Harmonics: secondary oscillations, aligning with larger residuals (2021 first harmonic).
- Predictive fidelity: log-periodic fits outperform 4-year cycles in RMS error, reflecting endogenous network-driven dynamics.
Each singularity reinforces the spine, redistributing price at a higher altitude rather than collapsing. Projections of that date: upper-quantile expansions $110,000–$130,000+, mid-2027 crest near $195,000, and historical overshoot potential $300,000–$350,000 before further redistribution.
Symmetry: Bitcoin adoption vs fiat debasement
The corridor is inherently symmetric: Bitcoin adoption is matched by persistent structural decay of fiat.
- Since the Nixon Shock (1971), U.S. M2 expanded from ~$710B to >$22.3T (~31×, 6.6% annualised), silently eroding purchasing power (~2.6% annual drag).
- Inflationary drag and the Cantillon effect: productivity grew ~80% (1947–2009), while real wages rose ~8%; asset holders captured disproportionate gains.
- Debt accumulation: federal debt >$38T, interest >$1T/year; austerity triggers recessionary feedback; debasement is the equilibrium, not a policy choice.
- Silent Depression: real income plateaued after the 2001 China Shock; purchasing power down ~50% since 1975; wages lag GDP by ~66% since 2000; corporate profits doubled (5→11% of GDP).
Societal consequences cited then: deaths of despair ~2.7×, drug/alcohol fatalities 5×/4.6×, suicides at Great Depression highs, birth rates down 20–30%. Generational assets diverge sharply — Boomers far outpace Millennials/Gen Z.
Macro signals — liquidity expansions, M2 uptrends, commodity curls, dovish interventions — provide temporary relief but reflect systemic fragility.
This is zero-sum, not asymmetric: each validation of digital scarcity corresponds to further fiat debasement, erosion of trust, and generational imbalance.
The digital stack and structural migration
- Stablecoins: $260–$307B market cap, $23–33T annual volume, anchor reserves in Treasuries, suppress yields, facilitate refinancing, migrate value to programmable infrastructure, amplifying symmetry.
- Regulatory clarity (GENIUS Act, CLARITY Act): reduces friction for institutional flows, accelerates adoption. Unlocking fresh tiers of capital.
- De-dollarization: fragmentation — local currencies for spending, USD for liquidity, Bitcoin for long-term reserve integrity.
- Sovereign allocations: >$120B by late 2025, projected toward $300B in 2026 — risk-managed adoption of digital scarcity.
The Chaos Corridor as a conservation law
Inside the corridor:
- Bitcoin oscillates, accumulates, and releases energy, adhering to the power-law spine.
- Singularities redistribute energy predictably, not chaotically.
- Legacy fiat erodes continuously via debasement, debt accumulation, and generational inequity as the cost of system persistence.
Volatility is the cost of truth — appreciation is inseparable from decay in the legacy paradigm. The power law ensures long-term structural integrity, while the corridor contains chaos and redistributes energy.
The Chaos Corridor is the price-level signature of the digital monetary transformation: bounded, directional, mathematically indifferent to legacy. It is bullish for digital scarcity, devastating for fiat fragility, and inevitable.
Research and educational use only. Not financial advice. Past scaling relationships can fail. Figures in this essay are of the original posting dates. Patria Capital / Quantitative Macro Intelligence.