Patria CapitalPATRIA CAPITALHard Asset Intelligence

QMI

Quantitative Macro Intelligence

Patria Capital Network Engine Matrix

A Multi-Layer Quantitative Framework for Bitcoin

At Patria Capital I view Bitcoin not merely as a speculative asset, but as a coherent, self-organizing global monetary network that follows predictable mathematical scaling laws.

That scaling was not discovered here. Giovanni Santostasi (Director, Scientific Bitcoin Institute) first identified Bitcoin’s long-run power law. Stephen Perrenod (Associate Director, SBI; PhD Astrophysics, Harvard) independently modelled the same family of laws and is co-author of the peer-reviewed paper. I built a live engine in that literature. I do not claim to be its founder.

The Network Engine Matrix analyzes Bitcoin across four interconnected layers. Each layer is backed by an independent power-law model, with its goodness-of-fit (R²) rigorously measured to show how reliably the model explains historical data (1.0 representing a perfect statistical fit).

The live expression of this Matrix is Chaos Corridor: a daily engine that re-estimates the scaling laws, draws the corridor around fair value, and publishes the network overlays on a single dashboard.
Chaos Corridor

31 October 2026. Zoom the chart to June 2026 if you want the $57k low. The live daily book is Members.

31 October 2026 · hover, zoom, pan

Spot
$77,291
Fair value
$144,731
Support (−1.5σ)
$51,173
Resistance (+1.5σ)
$409,337
Z-score
-0.91σ
Risk score
28.4 / 100
Addresses > 0
57,253,979
Hashrate
1065 EH/s

Addresses last printed on 2026-10-30 (latest price row had no address print).

Loading corridor…

Price, fair value, ±1.5σ support and resistance, composite risk, adoption, and hashrate. This public book is the 31 October 2026 print. The live daily book is Members.

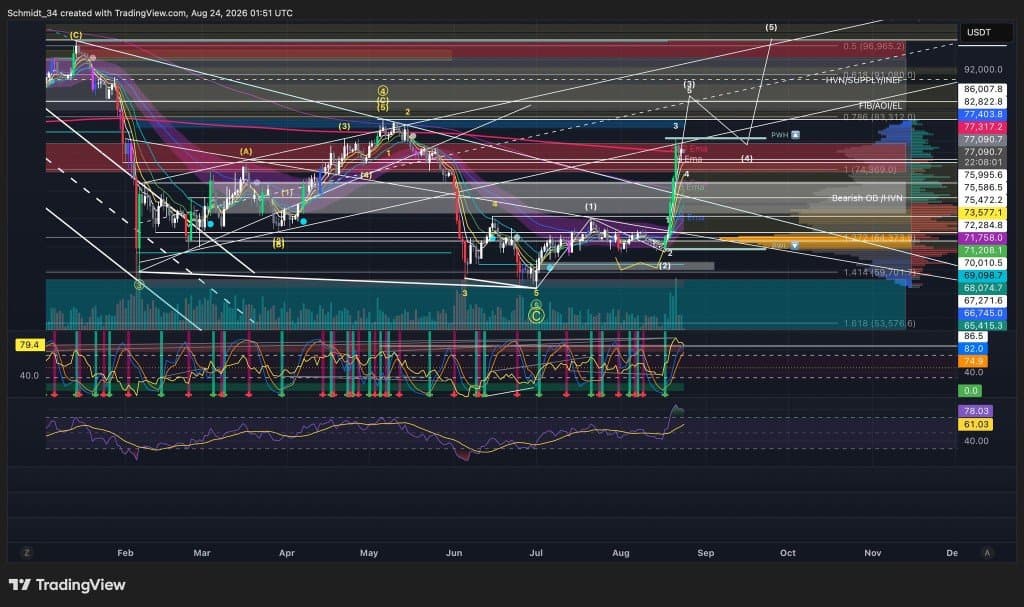
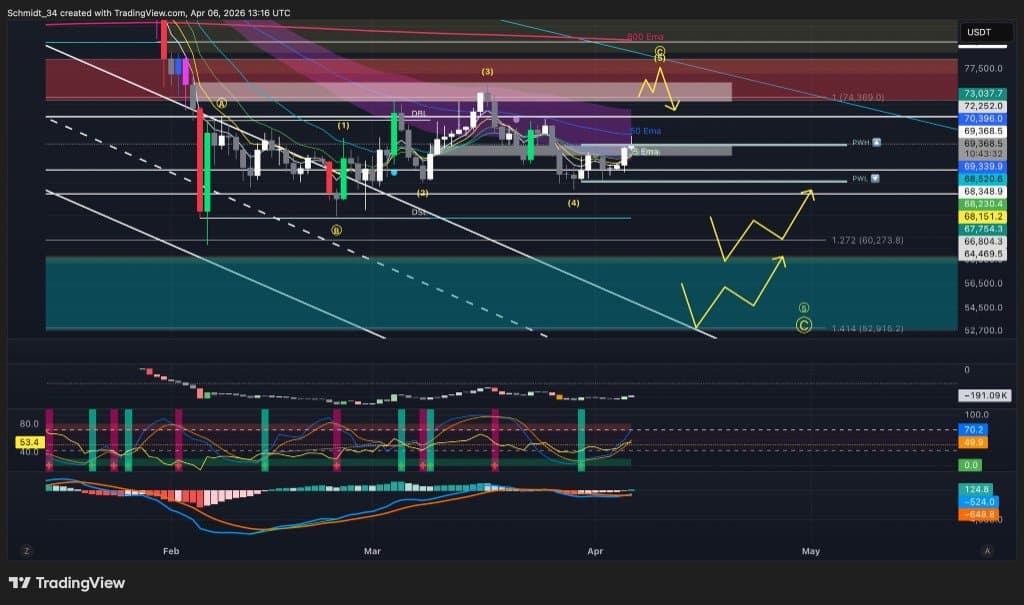
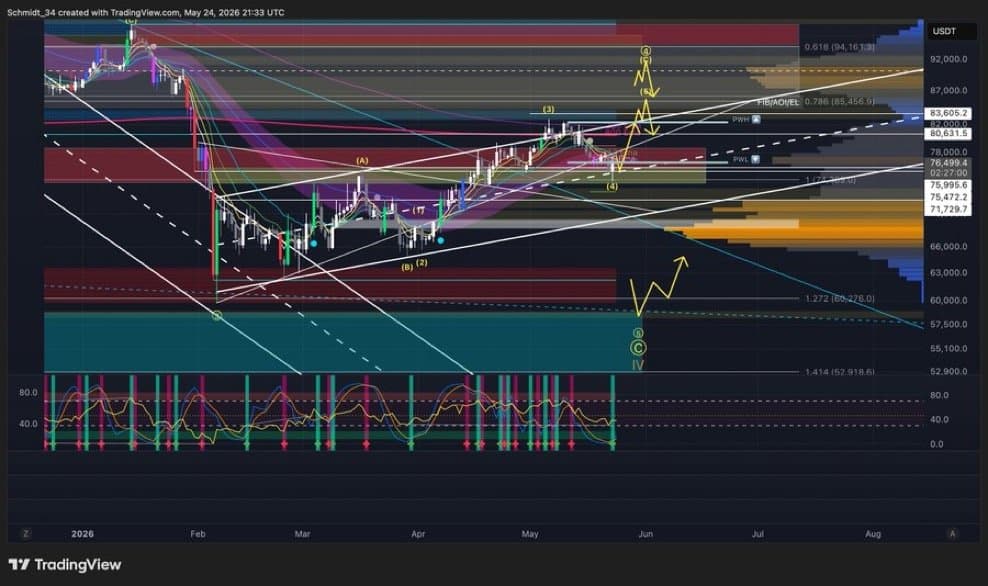
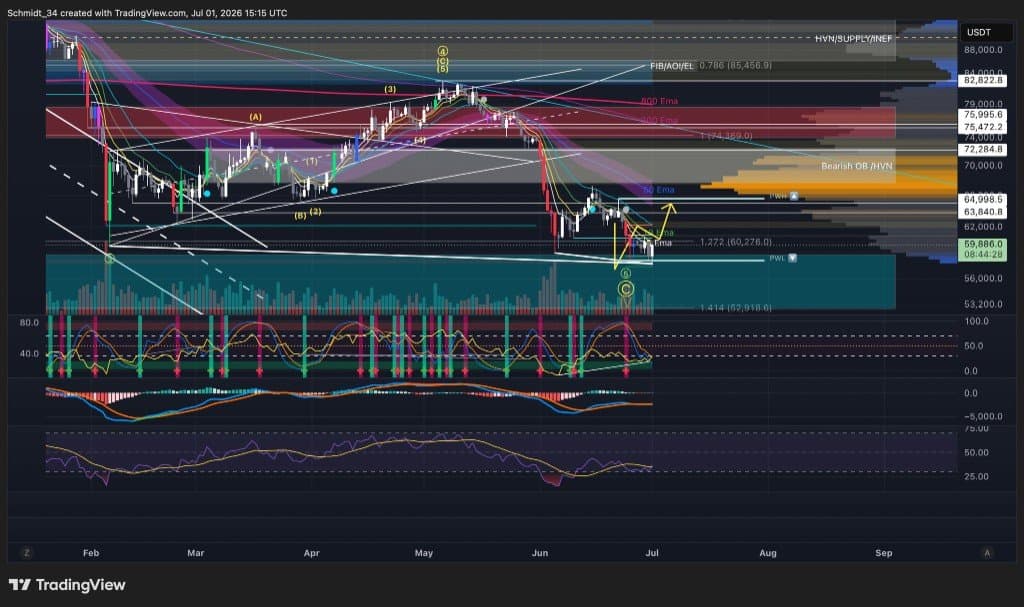
The $57k call

I held $57k as the bottom. Wider zone in March and April, then tightened. July tapped $57-58k. August the bottom was in.

Pinned post, 25 October 2026 · March 2026 zone · April 2026 zone · May 2026. First $57k hold

April 2026. Wider downside zone.
May 2026. $57k hold. Final downside target.
July 2026. Tap at $57-58k.
August 2026. Bottom in.

The Four Engines of the Network Engine Matrix

1. Valuation Engine (Price Layer)

  • Core Structural Power Law: log₁₀(Price) = a + β · log₁₀(t), where t = days since the Genesis Block (3 January 2009), fitted from day 560 — the exchange-era window.
  • Live estimation: a and β are re-estimated daily from the data. They are not frozen constants. The relationship typically prints at β ≈ 5.65 with R² ≈ 0.96 — an extremely strong long-term macro relationship.
  • Key Metrics: Power-Law Trend (structural fair value), Support (−1.5σ), Resistance (+1.5σ), Z-score.
  • Isolates structural fair value across market cycles, with short-term speculative noise stripped out.

2. Adoption Engine (User Network Growth)

  • Core Power Law: Addresses with balance > 0 ∝ t^β, with live β ≈ 3.0 (cubic time scaling).
  • R² Statistical Fit: ≈ 0.975 (excellent structural alignment).
  • Metcalfe’s Law Extension: Price ∝ (Addresses)^k — the theoretical bridge from user growth to monetary value.
  • Tracks real-world network utility: user acquisition expanding predictably, the physical demand under the price model.

3. Security Engine (Network Defense)

  • Core Power Law: Hash Rate ∝ t^β, with live β ≈ 11.1.
  • R² Statistical Fit: ≈ 0.964 (high capital-expenditure validation).
  • Interdependence: Mathematically tied to network value via Hash Rate ∝ Price².
  • Measures the computational and energy wall securing the ledger. Miner capex scales with valuation, which is what a 51% attack has to buy.

4. Statistical Risk Engine (The Chaos Corridor)

  • Core Model: The standard deviation of log-price residuals around the live power-law trend. This residual field is the corridor.
  • Key Metrics: Z-score (signed distance from trend, in σ), Support at −1.5σ, Resistance at +1.5σ, Composite Risk Score (0–100).
  • Composite Risk: A blend of valuation extension (Z), 30-day realised volatility, and 90-day momentum — the thermometer of how stretched, unstable, or fast the present move is relative to Bitcoin’s own history.
  • Replaces static indicators with a living envelope that travels with the trend. As time elapses, fair value rises; the corridor rises with it. Volatility is location inside a structure, not “noise.”

The Core Thesis Flywheel

The Self-Reinforcing Feedback Loop (the core thesis)

The Matrix demonstrates that Bitcoin behaves like an ecosystem. Growth in one layer mathematically triggers expansion across the others:

Time Elapses → Cubic Adoption (Addresses ∝ t³) → Quadratic Value (Metcalfe: Price ∝ Addresses^k) → Security Scaling (Hash Rate ∝ t^11) → Greater Institutional Confidence → Drives further investment

The uniform R² values exceeding 0.96 across the live layers confirm that this loop is highly resilient, mathematically sound, and historically intact.


How I Read the Matrix

This is a map for research, not a personal recommendation and not an order ticket.

  • Accumulation context: Price at or below −1.5σ Support + stable adoption growth + low composite risk → location looks cheap relative to the scaling law. It can still fall.
  • Equilibrium context: Price oscillating near the power-law trend + high R² engine alignment + mid risk → the market is paying something close to what time implies.
  • Exhaustion context: Price pressing +1.5σ Resistance + high Z + high composite risk → historically where the corridor has hosted euphoria. A place to be humble, not a short-sale alarm.

The model is a map, not the territory. The corridor tells you where you are. Position size decides whether you survive being wrong.


Sources

I did not discover Bitcoin’s power law. That science belongs to the researchers who established it.

Giovanni Santostasi — Director, Scientific Bitcoin Institute — first identified Bitcoin’s long-run power-law scaling.

Stephen Perrenod — Associate Director, Scientific Bitcoin Institute; PhD, Astrophysics (Harvard) — independently modelled the same family of scaling laws and is co-author of the peer-reviewed paper.

Santostasi, G. and Perrenod, S. (2026). A Mechanistic Derivation of the Bitcoin Price Power Law: Network Adoption Dynamics and Generalised Metcalfe Scaling. Nonlinear Science. Preprint: doi.org/10.5281/zenodo.19387099.

Chaos Corridor is my live operational engine in that literature. It is an implementation, not a claim of origin. The public chart is the 31 October 2026 OLS print with a ±1.5σ residual corridor. The live book is Members.